pie_chart_3d 0.0.7
SDKflutter
Platformandroidioswindowslinuxmacosweb
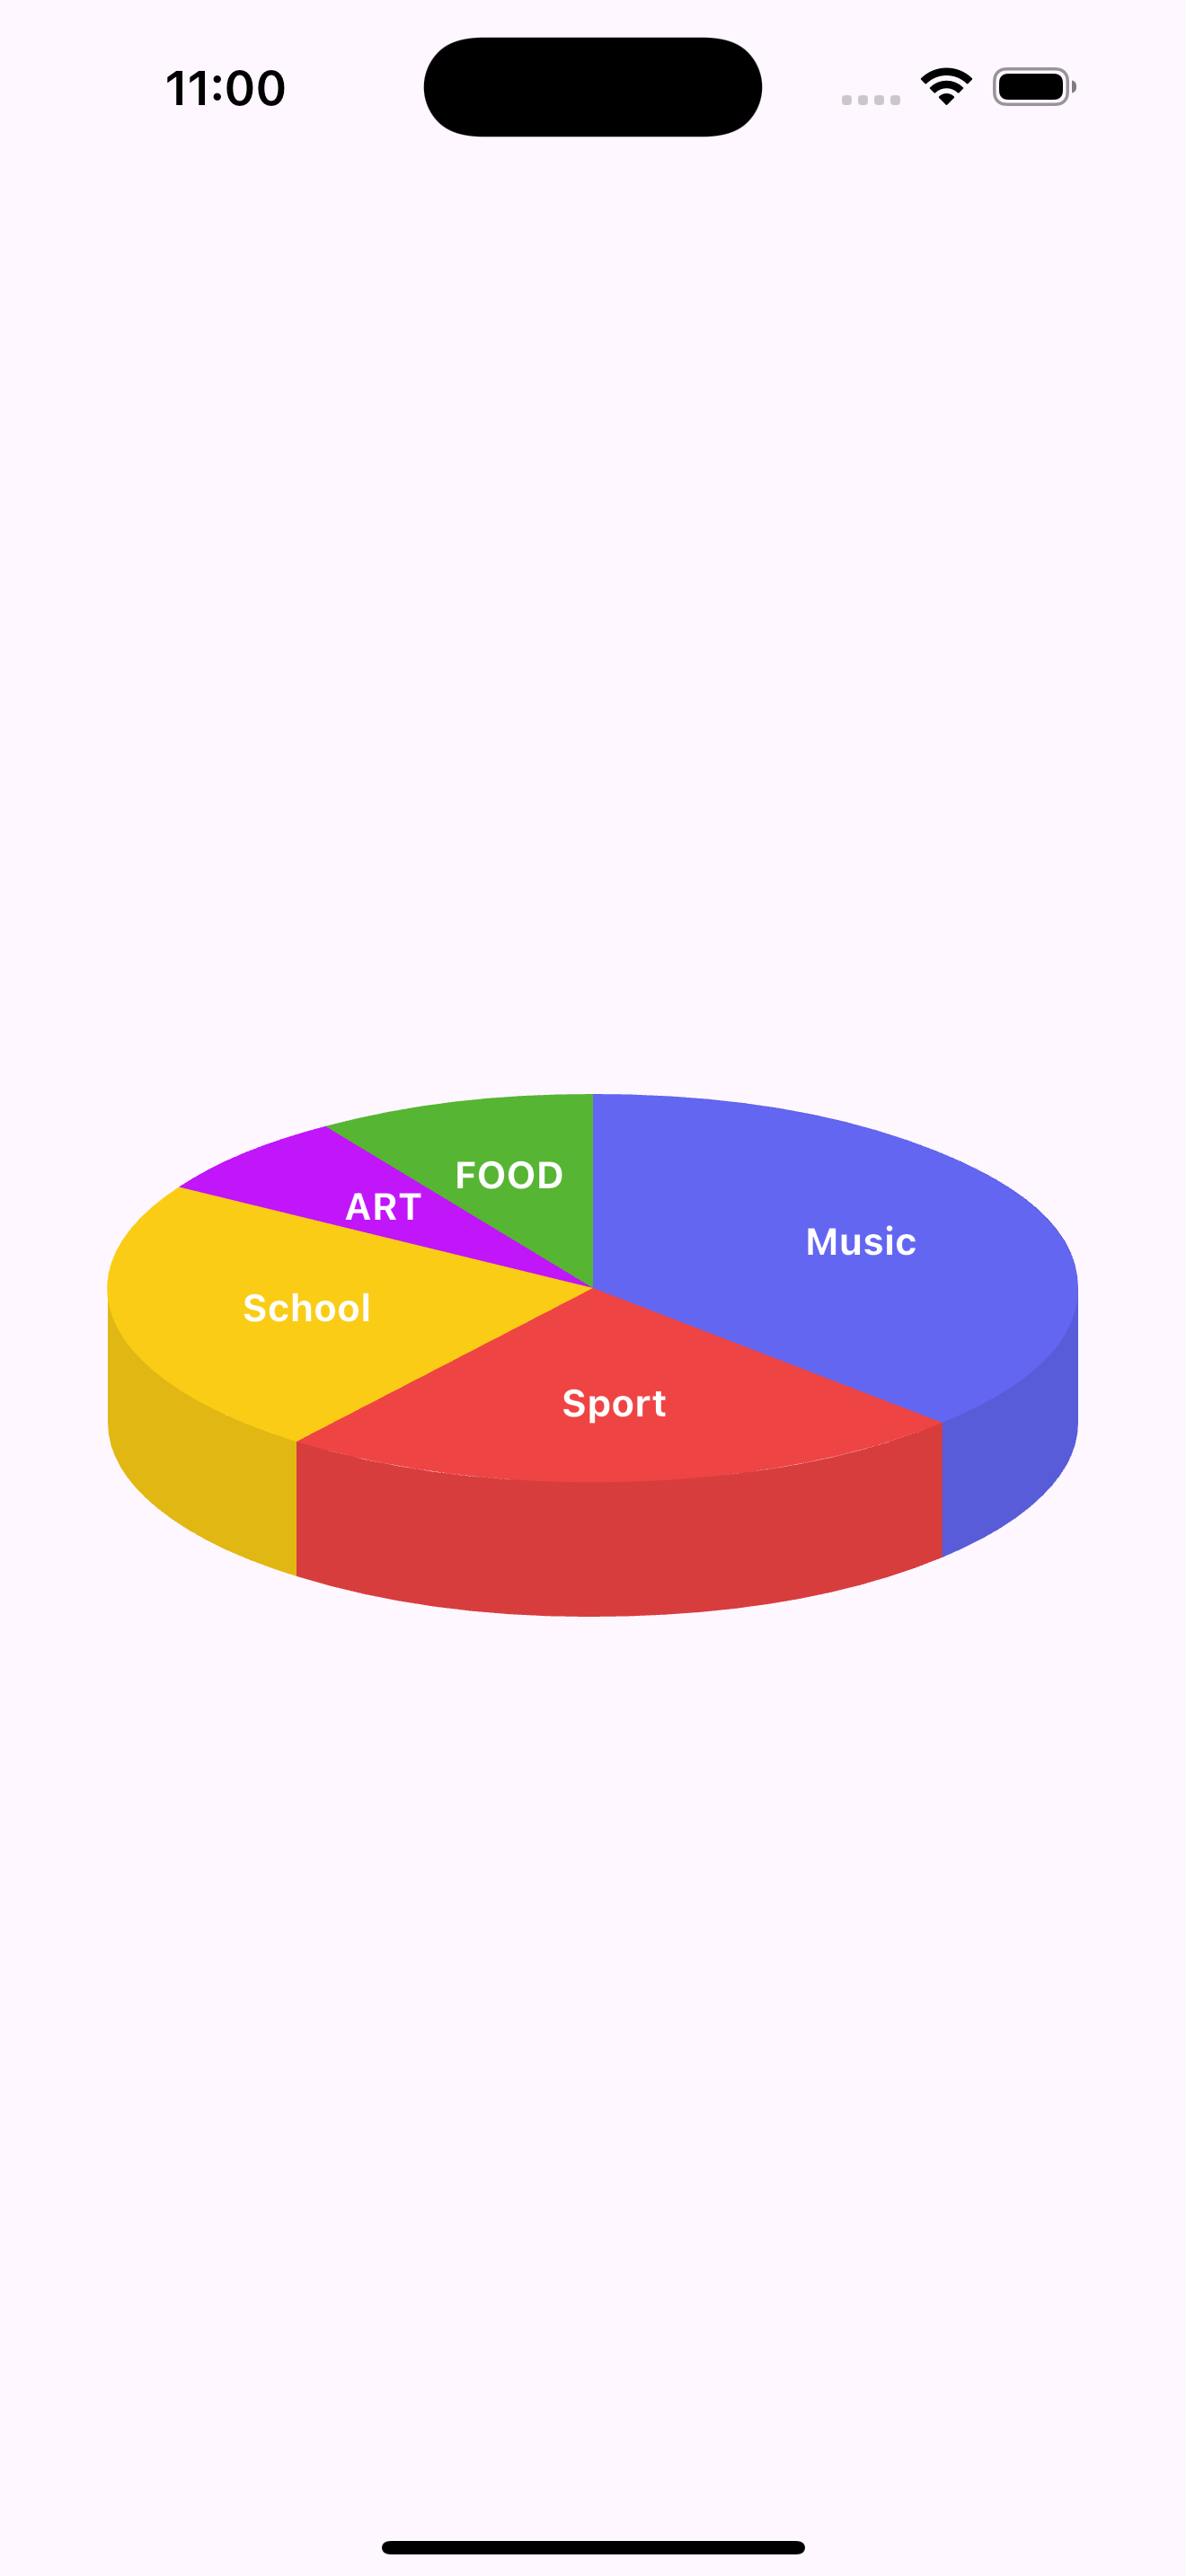
A lightweight and customizable 3D Pie Chart package for Flutter, built with performance and visual clarity in mind. Designed to deliver intuitive data visualization through dynamic 3D rendering, this package allows developers to easily integrate interactive, animated pie charts with depth and realism. Ideal for dashboards, reports, and any data-driven UI. Built with clean architecture and extensibility, suitable for both production apps and experimentation.
This package draws 3d Pie Chart using Custom Painter
Features
- Supports 3d view of Pie Chart
- Adjustable dept of the Pie Chart
Getting started
add package into your pubspec.yml file
Usage
class ExampleApp extends StatelessWidget {
  const ExampleApp({super.key});

  @override
  Widget build(BuildContext context) {
    return Scaffold(
      body: Center(
        child: ThreeDPieChart(
          data: _getChartData(),
          options: PieChartOptions(
            height: 400,
            width: 400,
            depthDarkness: 0.9,
            ellipseRatio: 0.4,
            shadowHeight: 50,
          ),
        ),
      ),
    );
  }

  List<ChartData> _getChartData() {
    return [
      ChartData(category: 'Music', value: 80, color: Color(0xFF6366F1)),
      ChartData(category: 'Sport', value: 50, color: Color(0xFFEF4444)),
      ChartData(category: 'School', value: 50, color: Color(0xFFFACC15)),
      ChartData(category: 'ART', value: 15, color: Color(0xFFC115FA)),
      ChartData(category: 'FOOD', value: 20, color: Color(0xFF56B533)),
    ];
  }
}
Additional information
If you found any error, open ticket on Github.
Please feel free to start Contribution. It still needs lot of features.